Covid-19 Vax Rate and New Cases
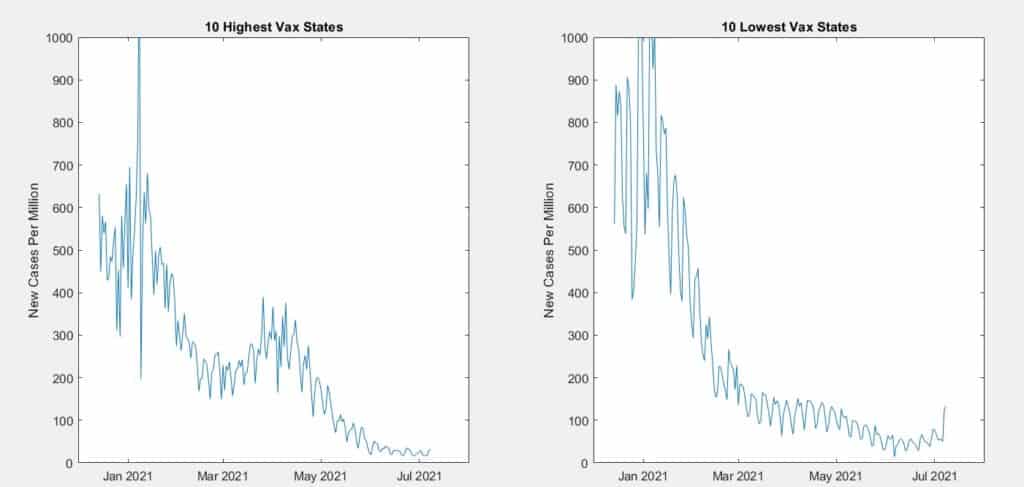
If your state has a low vaccination rate, you are four times more likely to catch the disease than if your state has a high vaccination rate.
The ten states with the lowest Vax rates are experiencing 125 new cases per million each day, while the ten states with the highest Vax rates are seeing 29 new cases per million each day.
Background
I downloaded CDC vaccination and new case data on July 9. From that, I summarized the results for the ten states with highest vaccination rates and the ten states with the lowest. Figure 1 shows the frequency of new cases in each group.
Vaccination and New Cases
In Figure 2 is shown the actual daily new cases with the vaccination rate on that date.
The vaccination information only became available in mid-March at which 10% of the population had received it.
The left (blue) axis shows new cases reported with the blue graph. Orange in the right axis shows the percent of vaccinated people in the grouping, as does the orange graph line.
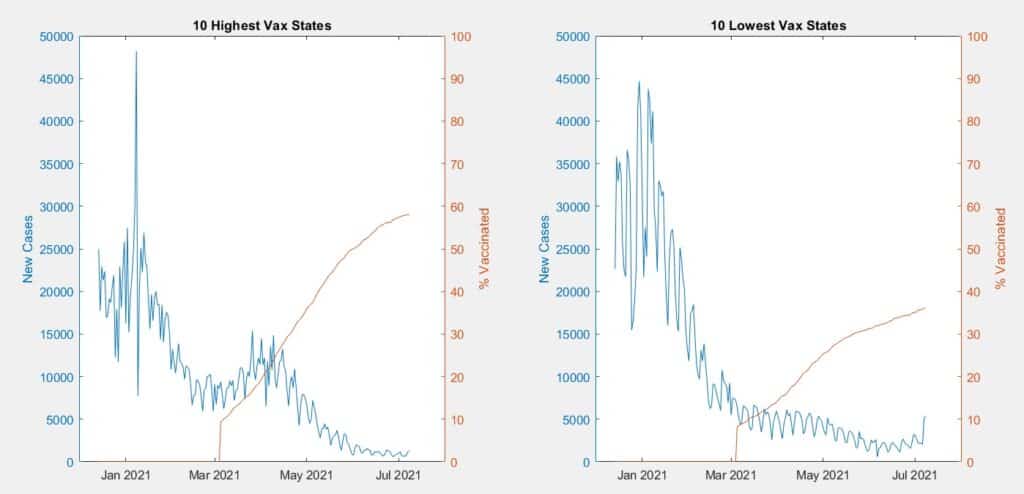
In the left plot, the rapid rise in vaccinations is mirrored by a rapid fall in new cases. In the right plot, both effects are less pronounced.
The irregularity in the data is visible, including the high peak and then trough in the high Vax states in early January.
Interpreting Data
Is this reading too much into a short length of data? No
As investors scramble for the slightest advantage in stock prices to make profitable trades, those interested in helping society in the pandemic also must search find clues to help us quickly as possible.
Herd Immunity
Do reports of Covid-19 breakthrough cases, despite vaccination, make you less likely to get the vaccine yourself?
Herd Immunity has been touted as a way to end the pandemic. Vaccine breakthroughs occur in less than 10% of all vaccinations. That protection (above 90%) is far superior to herd immunity.
