Inflation and the Federal Reserve Board
Recent Inflation
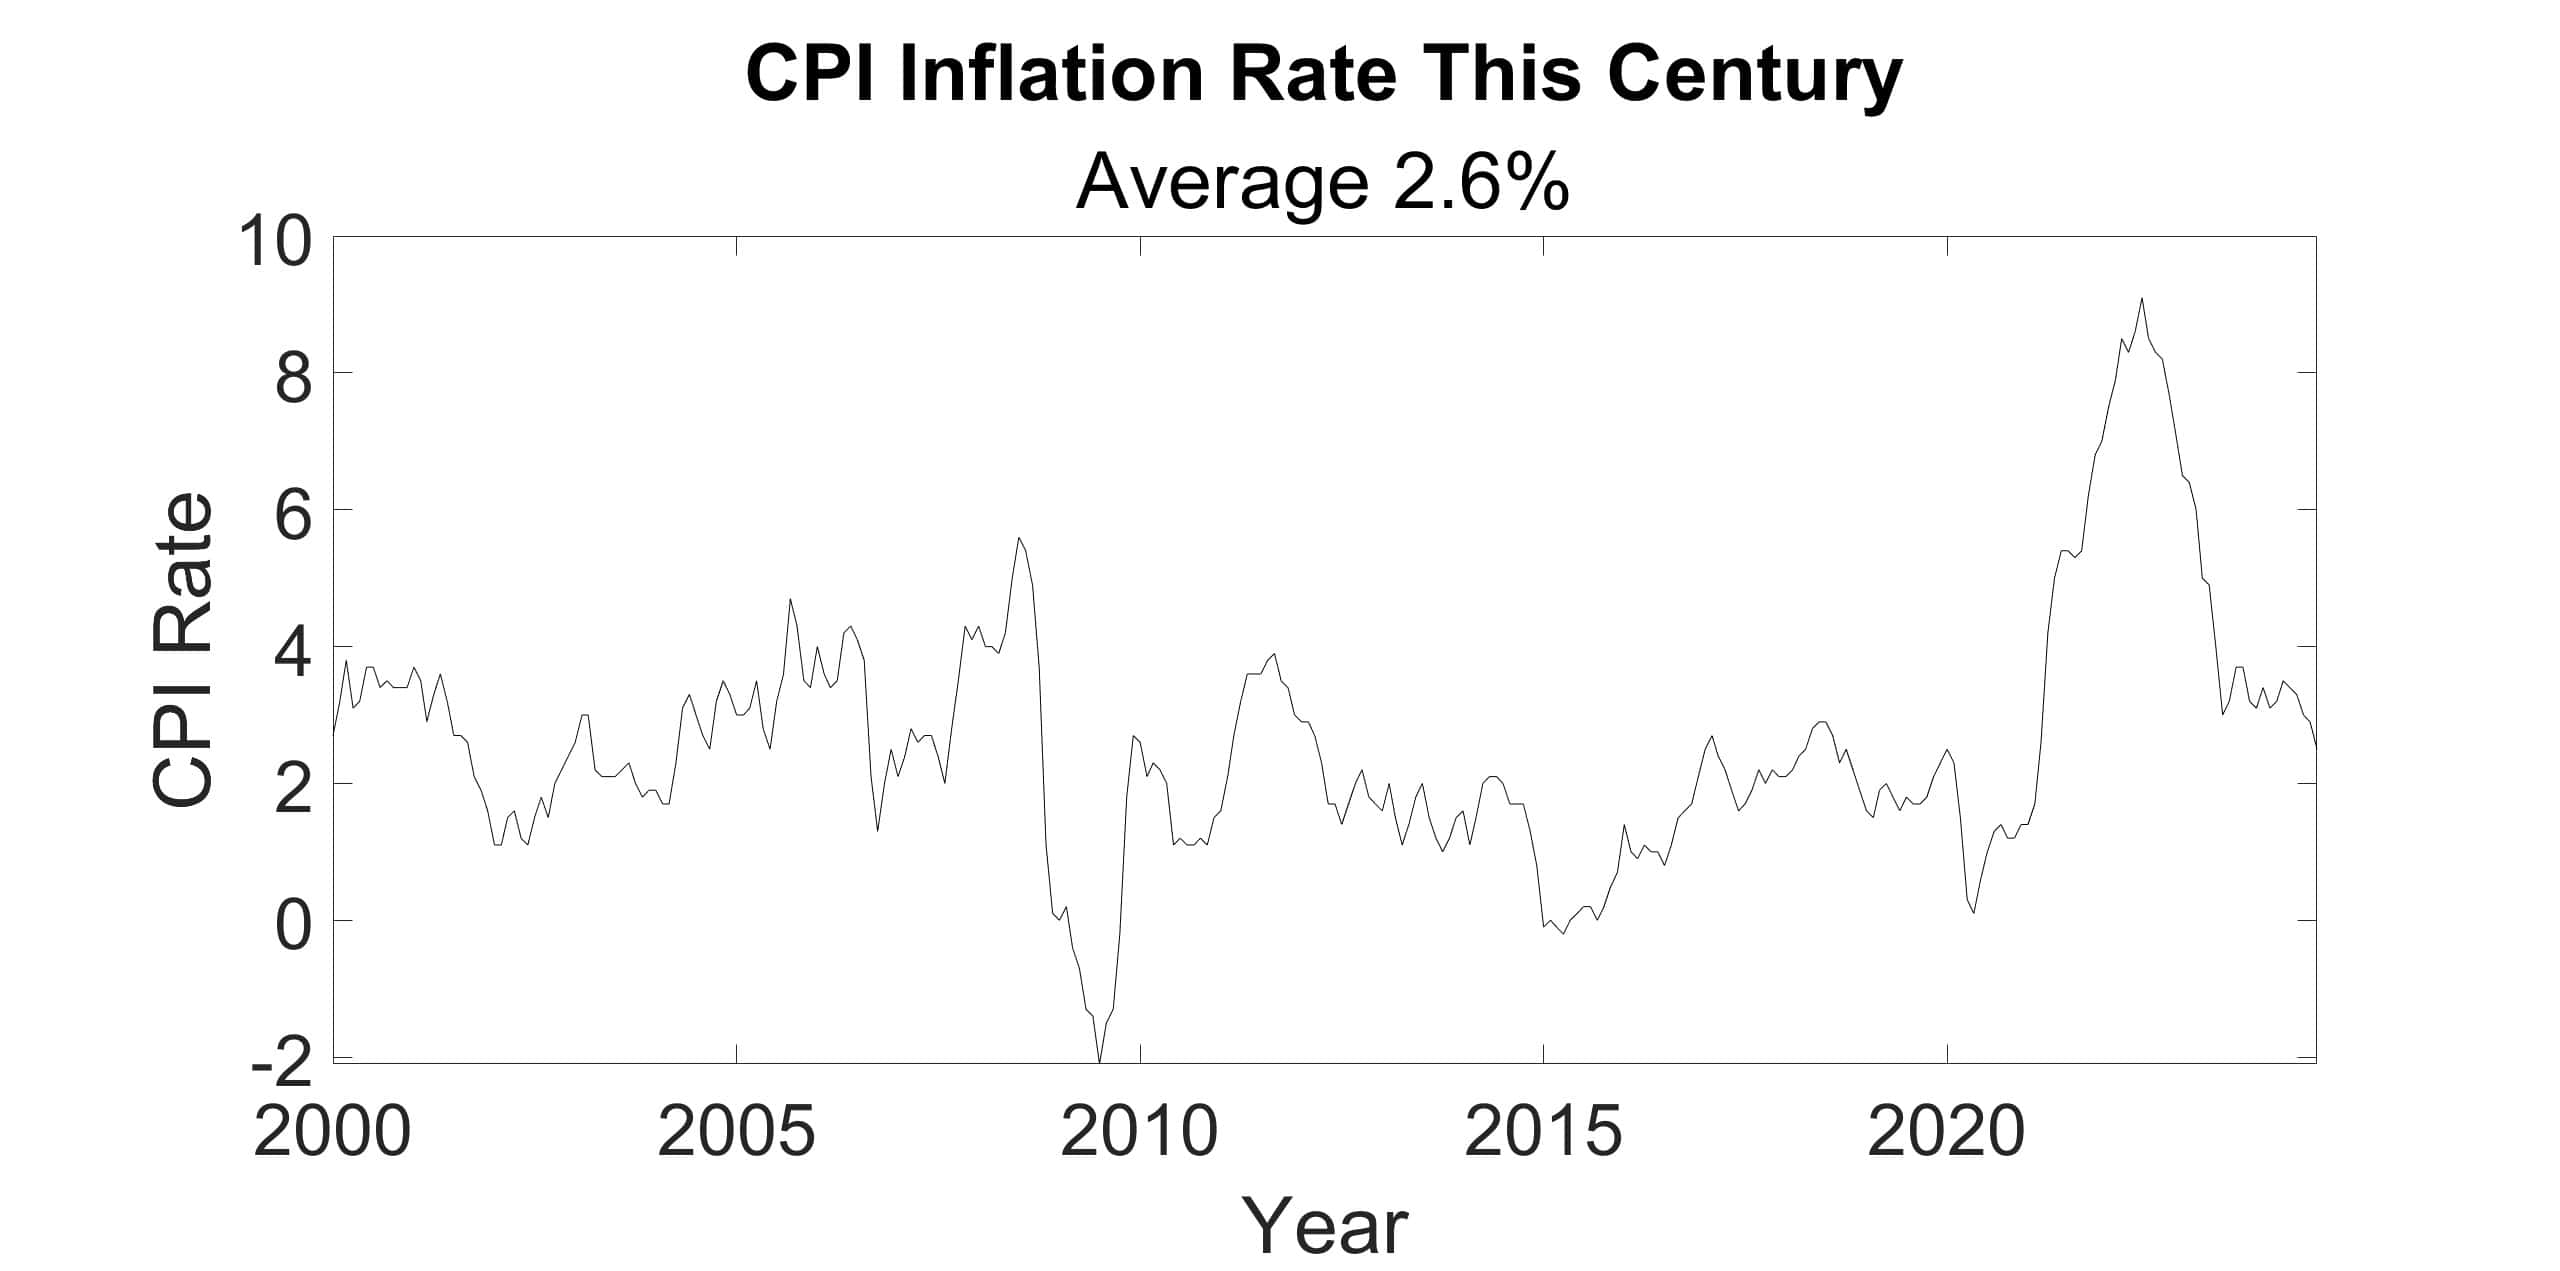
The figure above shows CPI inflation from 2000 to 2024. (Double click on the figure to enlarge it). Inflation fluctuated between 0 and 4% with two unusual spikes. One in 2008-2009 during the Great Recession resulting from the financial shenanigans of the Housing Bubble and Crash and the 9% peak in 2022 followed by decline. This second inflationary surge resulted from the pandemic lockdown and the government’s fiscal response to counter the significant threat to the entire economy which avoided the catastrophe.
Nonetheless, the inflation was a problem requiring action by the Fed. That’s the focus of this post.
US consumers experience is measured by CPI (Consumer Price Inflation), though the Federal Reserve Board uses another to guide its policies. You can read more about that in Inflation Measures, which explains the differences between the two main inflationary indexes and the reasons the Federal Reserve Board relies on PCE Core (Personal Consumption Expenditures excluding energy and food) for its decision-making.

In the right figure, we can look more closely at the march of inflation during and following the pandemic, from near zero at the start of 2020, shortly before the COVID danger became clear, until the end of September 2024 when inflation was returning close to the Fed’s 2% target.
Why did we have to suffer that pandemic inflation? How prompt was the Fed’s response?
Fed Reaction to Data

The Fed funds rate remained near zero from the onset of the pandemic until early 2022. It wasn’t until inflation surpassed 8% that the Fed hiked its Funds rate range from 0.00%-0.25%. In a 16 months, it raised its rate six times, peaking at 5.25%-5.50% in July 2023.
On the far right of the figure you can see the lowering of the Funds rate that the Fed announced in Sep 2024, marking the end of the tightening and the start of easing, an important inflection point for investors in bonds.
Success or Failure
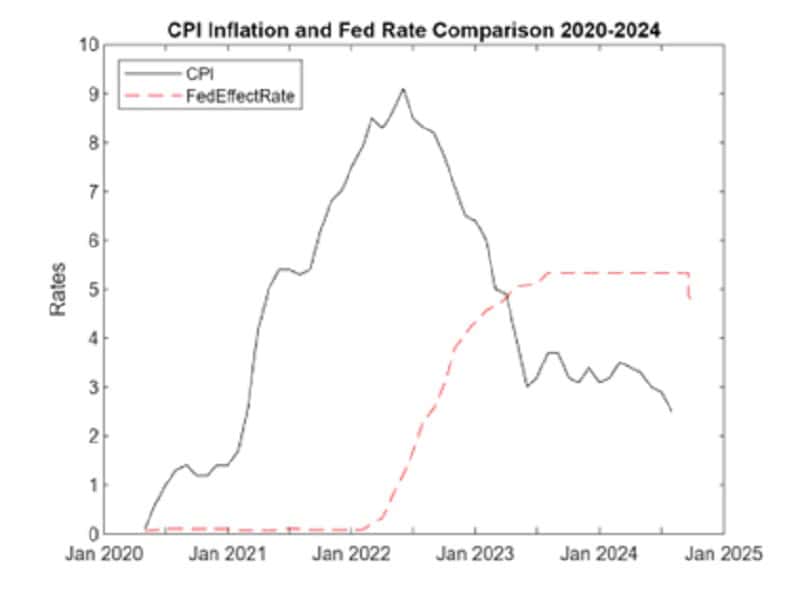
Now that we have observed both inflation and the Fed rate, let’s consider them together in a plot (right) with a common timeline on the base and a shared rate elevation.
It’s striking that the Fed did not start raising its rate until inflation was near its peak. Many call this too late, considering the difficulties inflation caused in household budgets, yet the justification for such a low Fed rate was necessary to forestall further economic slowdown due to economic disruption due to social distancing, supply chain issues, and loss of worker income.
Regardless of the exact timing of the Fed’s start to raising its Funds rate, the effect on Inflation was quick and in the desired direction, downward. When the Fed stopped rising rates in July 2023, inflation was range bound a low level, until after a year when inflation slid lower and closer to the 2% target.
In April 2023, the rising Fed rate equaled the falling inflation rate. After this intersection, the Fed rate was greater than the inflation rate, implying that the real Fed rate (adjusted for inflation) was greater than zero. It cost more to borrow than the inflation rate was deflating the dollar.
It’s important to understand the relation between the Fed rate, the inflation rate, and business activity. The core idea is a positive real Fed rate (Fed minus Inflation) costs enterprises real money to start new economic activity. On the other hand, when the real Fed rate is negative, enterprises can repay loans with deflated dollars, making them more willing to accept risk on new endeavors.
It’s called easy money when the inflation rate is higher than the Fed rate. Tight money occurs when its rate is higher than current inflation. The Fed’s 2% inflation target adds an empiric twist to this straight-forward concept.
This recent bout of inflation resulted in one dollar held since 2020, now having the purchasing power of only eighty-five cents.
Stagflation Reaction and Result

The Fed’s ability to curb inflation during stagflation (50 years ago) is often celebrated as a triumph. What insights can we glean from comparing inflation and Fed rates during the oil crises of the 1970s?
In the figure on the left, the Fed rate appears to lead the inflation rate to its 1975 peak and then falls in tandem with inflation through 1978. This synchronicity was unexpected. Based solely on this chart, it might seem that the Fed rate caused the inflation rather than reducing it. However, this interpretation overlooks other contributing factors and the broader economic context of the time. The Oil Embargo and the dramatic increase in energy costs triggered the inflation.
In 1980, there was a second inflation spike, reaching 15%. The Federal Reserve’s rate increased in tandem with the Consumer Price Index (CPI) until it peaked at 19%, even as the inflation rate declined. This closer alignment between rising Fed rate and falling inflation was more in line with expectations. The inflation spike was largely due to external factors, such as the 1979 Iranian revolution, which led to a quadrupling of oil prices. The Fed initially struggled to keep up with these events but eventually brought inflation back down.
There was a large impact from that era. A dollar bill held from June 1972 had lost fifty-eight percent of its purchasing power before inflation waned in the early 1980s.
Future
Will inflation make a comeback? Oc course, it will. The primary driver occurs when there’s a significant under supply of a particular good or service relative to the high demand.
Which goods and services will trigger that? That’s usually not known until after the deficit of supply has initiated inflation. If businesses use items undergoing inflation in the production of other goods and services, they can cause inflation to spread from specific items to the broader economy. For example, during the stagflation fifty years ago, energy price increases eventually permeated the entire economy.
The US debt overhang might have a similar effect if interest rates need to increase to attract new borrowers to purchase US Treasury debt. This increase in interest rates would, in turn, elevate the production costs of all goods and services, shifting the intersection of the quantity supplied with the quantity demanded. Less is supplied than demanded at the current price.
Monetary and Fiscal Policies
The Federal Reserve Board plays a crucial role in managing the US economy by responding to inflation and GDP shortfalls and economic crises, as guided by Taylor’s Rule. As the primary monetary regulatory agency, the Fed’s actions are essential in maintaining economic stability.
However, the fiscal and business regulatory policies set by the House and the Executive branch often influence the effectiveness of the Fed’s interventions. In addition, poorly constructed policies by the House and the Executive branch can lead to economic imbalances, such as inflation and GDP shortfalls, requiring the Fed to take corrective measures, highlighting the interconnectedness of monetary and fiscal policies in achieving overall economic health.
Fed Rate and GDP
The relationship between the Federal Reserve’s fund rate changes and GDP is intricate and multifaceted. When the Fed adjusts the federal funds rate, it influences interest rates throughout the economy, affecting borrowing costs for businesses and consumers alike. A higher federal funds rate typically leads to increased borrowing costs, which can slow down investment and consumer spending, ultimately cooling economic growth. Conversely, a lower federal funds rate can stimulate economic activity by making borrowing cheaper, encouraging spending and investment.
However, the impact on GDP is not immediate. There is often a lag between the Fed’s rate changes and observable effects on the economy. This delay occurs because businesses and consumers take time to adjust their spending and investment decisions in response to new interest rates. Other factors, such as global economic conditions, fiscal policies, and market expectations, also play a role in shaping the overall economic response.
Understanding these dynamics is crucial for policymakers, businesses, and investors. As we continue to watch the Federal Reserve’s actions and their implications, it is essential to stay informed and proactive.
Curious about how GDP reacts to changes in the FED fund rate? Ever wondered about the lag time for GDP adjustments? Stay tuned for an upcoming investigation with a deep dive into these questions and more. Don’t miss out!
Additional Information
Fed Dual Mandate
Inflation Measures
Taylor’s Rule