Inflation Measures
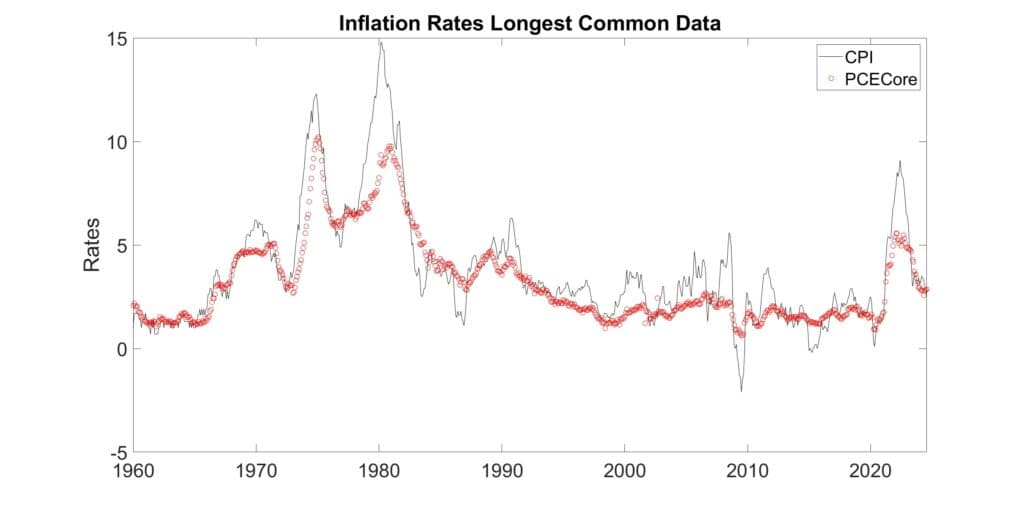
In the figure above, the two best known inflation measures since 1960 are displayed. (Click on image for larger display.) The Consumer Price Index (CPI), the dark line has higher highs and lower lows than the Personal Consumption Expenditure core index, which ignores the changes in energy and food inflation. What possible reason is there to use an inflationary index that ignores sticker shock at the pump and the grocery store?
Consumers in urban areas feel inflation as reflected by CPI, while the Federal Reserve Board has declared that PCE Core more accurately reflects the inflation that its monetary policies can affect. How so? The Fed Funds rate affects economic activity by easing or tightening lending; but inflation in food prices is mainly traced to weather conditions in the growing season and energy prices inflate due to foreign geopolitical decisions.
Since 1960, CPI inflation averaged 3.54% with a standard deviation of 2.8%, while PCE Core inflation averaged 3.24% with a standard deviation of 2.1%. The CPI averaged only 0.3% higher, although with a wider variation of its reported inflation rates. That’s so abstract, let’s look at the most recent inflation.
Pandemic Inflation
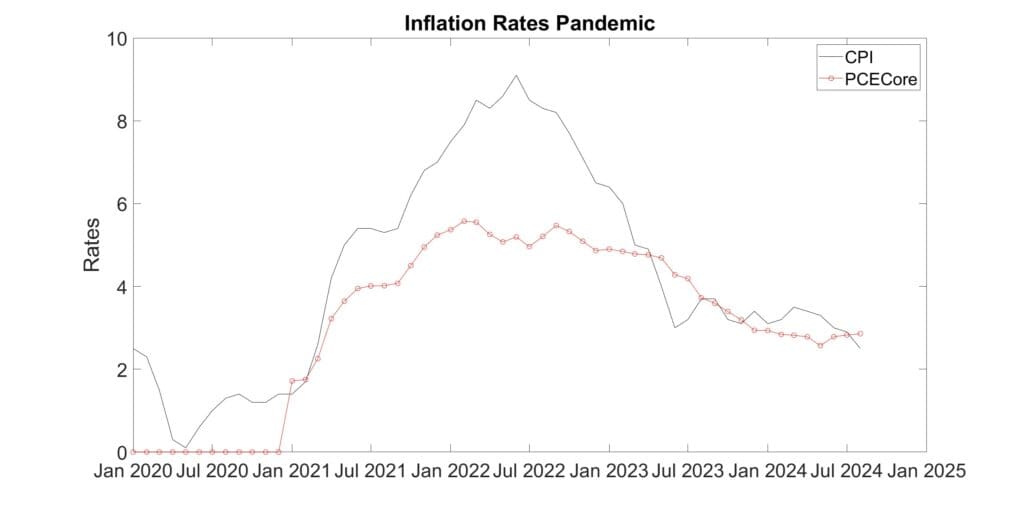
The figure above limits the view of the inflation measures to the pandemic era. The dark CPI line of inflation felt rose much higher (9%) than the red PCE Core peak (below 6%) which excludes pump and grocery prices. During the height of the pandemic, health fears in the workplace negatively affected the economy. The president and Congress passed massive fiscal stimulus which increased the number of dollars to buy available goods. This driver of inflation was outside the control of the Fed, but it had to react to it. Another pandemic impact was a supply chain disruption. Separately, the Russian invasion of Ukraine disrupted global food trade while Western sanctions on the Russia put pressure on energy prices.
It’s interesting that neither measure rose above 2% until a year after the pandemic hit. However, both measures showed rapid inflation from early 2021 until peaking mid-2022.
Final Thought
The Fed’s hiking of interest rates from March 2022 through July 2023 knocked both inflation measures down, though the CPI fell faster and steeper than the PCE Core measure.
The Fed’s (in)famous 2% Inflation target should be interpreted as 2% on the PCE Core measure, not the CPI we citizens experience.
Additional Information
Bureau of Labor Statistics more on CPI
Bureau of Economic Analysis more on PCE Core
Fed Dual Mandate more on 2% Inflation target
Big Mac Inflation Measurement data from 2015, but still pertinent


