Learning Bonds
In 2022, bondholders faced a stark reality: an average loss of 13.7% of their principal. This downturn was precipitated by the Federal Reserve Board’s (Fed) aggressive monetary policy shift, which saw the federal funds rate escalate from near zero to upwards of 5% by the end of 2023. This begs the question: could investors have shielded their principal from such erosion?
Upon scrutinizing my bond funds, I unearthed several insights. As a passive investor, I favor index funds for their diversified risk profile and low fees. My investment philosophy is one of steadfastness; I refrain from altering my asset allocation. Thus, in 2022, I did not pivot away from bonds—or stocks, which fared even worse—towards cash.
It’s well-documented that bond funds appreciate in value when interest rates decline. The inverse is also true: they depreciate when rates ascend. The impact of interest rate fluctuations is more pronounced on bonds or bond funds with longer maturities or durations.
A widely accepted heuristic in bond investing posits that a 1% uptick in interest rates will result in a corresponding decrease in the value of a 10-year Treasury bond with a 9-year duration by 9%. Yet, the reality of 2022 defied this expectation. Interest rates surged by over 3%, yet 10-year Treasury bonds did not plummet by the anticipated 27%. The actual depreciation was significant at 13%, but this was less than half of the predicted figure, casting doubt on the reliability of this rule of thumb.
This discourse centers on the ramifications of the Fed’s actions on bond portfolios, distinct from the rationale behind the Fed’s rate adjustments, which is discussed in the Fed’s Dual Mandate.
Bond Terms
When headlines proclaim “Interest rates are rising,” they often fail to specify which rates they’re referring to. For our purposes, we’ll zero in on the Federal Funds Rate and U.S. Treasuries, ranging from short-term (2-year bonds) to long-term (10-year bonds).
The Federal Funds Rate is the benchmark interest rate that dictates the cost of overnight borrowing among major banks to meet reserve requirements. While casually referred to as a fixed percentage, the Federal Funds Rate is, in fact, a target range. For instance, a headline rate of 5.50% anchors the rate within a band of 5.25% to 5.50%.
Banks engage with the Federal Funds Rate daily. The precise rate within the Fed’s specified range that transpires is known as the Fed Effective Rate—the rate employed throughout this analysis.
For comparative ease, the rates plotted in this post have been normalized to 100 on the starting date. This standardization facilitates straightforward comparisons across different rates.
U.S. Treasuries are government bonds sensitive to changes in the Fed rate, which in turn influences bond prices. This discussion is confined to 2-Year and 10-Year Treasury bonds.
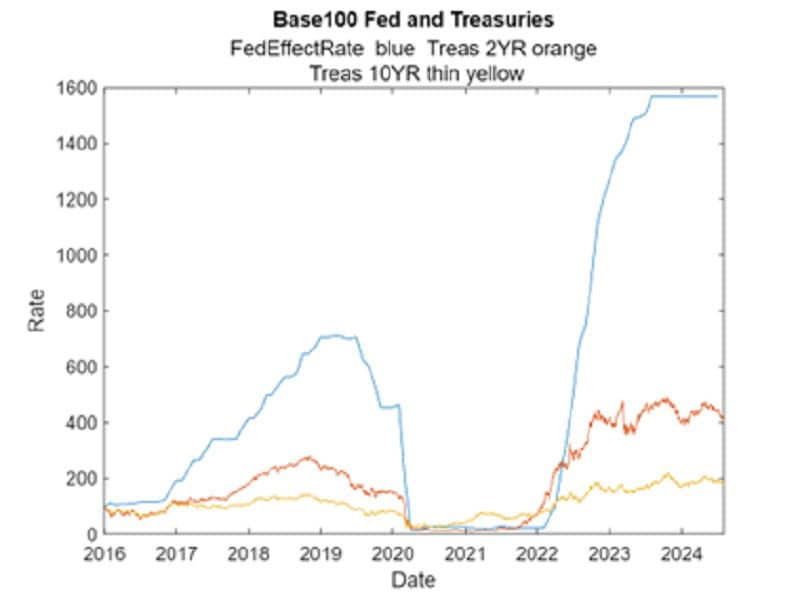
The accompanying chart, titled “Base100 Fed and Treasuries,” spans the years 2016 to 2024. The blue line representing the Fed rate exhibits significant relative shifts. In January 2016, the Fed Effective Rate was a mere 0.34%, represented as 100 on the relative rate scale. By July 2023, the rate had escalated to 5.33%, an increase of nearly 16 times the initial rate.
In the chart, the orange line tracing the 2-Year Treasury bond yields reveals a correlation with the Fed rate, albeit at a quarter of the magnitude. The yellow line for the 10-Year Treasury bond yields demonstrates an even more subdued response to changes in the Fed rate.
The Total U.S. Bond fund I utilize has maturity of 8 years and a duration of 6 years. The rate of the 10-Year Treasury bond acts as a barometer for the valuation shifts of the Total U.S. Bond Fund, which will be further explored in “Lessons for Bond Allocation.”
The TIPS fund in my portfolio, with a duration of 2.5 years, is best benchmarked against the 2-Year Treasury index to gauge its performance, particularly in an inflation-protected context.
If you are a more active investor than me, you might consider with the Fed poised to raise interest rates to switch to a longer duration bond fund. Also, as described in the section Treasury Rates and Bond Holdings, inflation-protected TIPS funds have performed better than the Total US Bond market since 2019.
Fed Funds and Bond Holdings
In pursuit of optimal performance—or in the context of 2022, the least detrimental outcome—I’ve analyzed the relative changes in the Fed Effective Fund Rate, a Total US Bond fund, and an inflation-protected, short-term TIPS fund. The data spans from the onset of 2019 to the close of July 2024, encapsulating a period marked by rising rates, near-zero rates, the Fed’s hiking cycle, and a plateau in Fed rates that’s anticipated to conclude in September 2024.
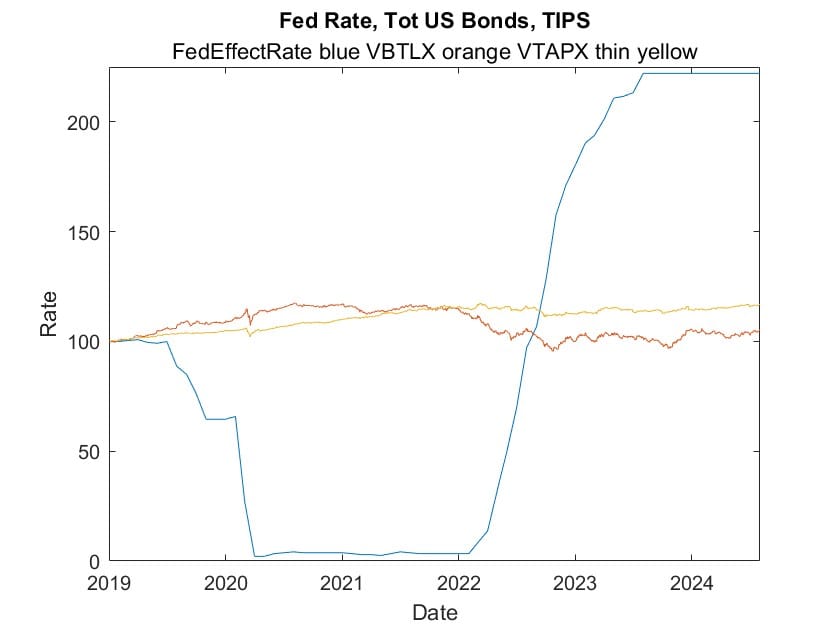
The Fed Rate (depicted by the blue line) underwent significant fluctuations over the past five years. In contrast, both bond funds exhibited much narrower variances. The Total US Bond fund (represented by the orange line) generally trended inversely to the Fed’s adjustments, while the TIPS fund maintained a remarkably stable and low-volatility valuation. As such, TIPS funds can offer a measure of stability in a portfolio during periods of interest rate volatility.
The muted response of the Total US Bond fund to the Fed’s pronounced rate changes over this half-decade of intense monetary policy action is noteworthy.
While the Fed Funds rate is a catalyst for numerous shifts within the bond interest rate framework, it’s the changes in Treasury bond rates that more accurately reflect the impact on bond fund valuations. This is because the Fed Funds rate primarily influences short-term interest rates, whereas Treasury bond rates, particularly those with longer maturities, are subject to a broader range of economic forces.
Understanding the nuanced interplay between Fed rate changes, Treasury bond rates, and bond fund valuations is crucial for maintaining a resilient bond portfolio in the face of varying economic conditions.
Treasury Rate and Bond Holdings
In the visual representation focusing on the period from 2021 to 2024, we can discern the interplay between rising inflation, the Federal Reserve’s rate hikes, and the fluctuations in Treasury yields during a time when the Fed’s rates have stabilized at elevated levels.
Throughout 2021, the 10-year Treasury Bonds rate (illustrated by the blue line) experienced an ascent and subsequent descent, influenced by the interwoven dynamics of economic shifts and pandemic-related uncertainties. With the onset of March 2022, this rate began its ascent in tandem with the Fed’s rate hikes, a trend that persisted until July 2023, albeit through a series of ebbs and flows rather than a linear progression. It’s important to note that the movements of the 10-year Treasuries are as much, if not more, a reflection of the collective economic sentiment and financial forecasts as they are a response to the Fed’s interest rate decisions.
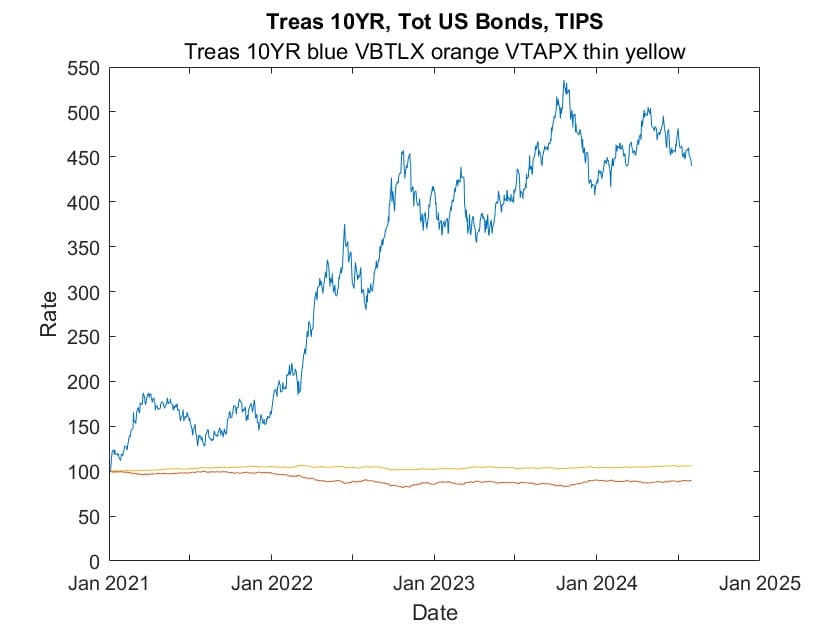
The Total US Bond fund (depicted by the orange line) has seen its value diminish, falling nearly 10% below its initial value at the start of 2021. In contrast, the TIPS fund (represented by the thin yellow line) has not only maintained its ground but has actually appreciated by 6%. This uptick is subtle within the graph, overshadowed because the Treasury rate concluded the period at a level 4.5 times its inception.
Performance Analysis and Strategic Outlook
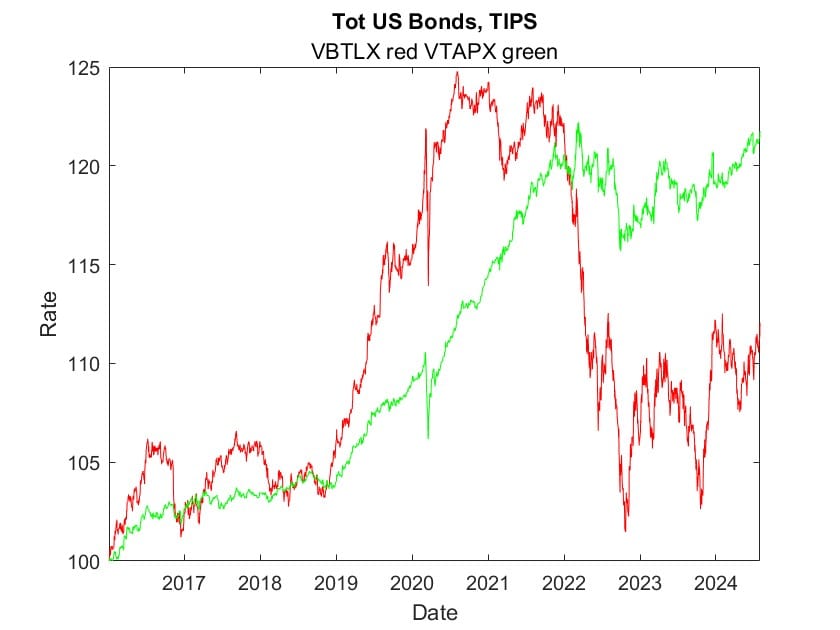
The accompanying plot delineates the performance trajectory of two pivotal bond types within my portfolio: the Total US Bond fund and the short-term TIPS fund. Tracing their journey from 2016, we observe that before the Federal Reserve’s rate hikes in 2022, the Total US Bond fund consistently eclipsed the inflation-adjusted TIPS fund. Post-March 2022, however, the tables turned as the TIPS fund’s value ascended, while the Total US Bond fund relinquished most of its accrued gains.
Forward-Looking Considerations
In contemplating the future allocation between Total US Bonds and TIPS, the pivotal question arises: Will the Federal Reserve’s future actions lean towards easing, or will inflation re-emerge? While historical data offers a rearview mirror perspective, bond valuations are inherently forward-looking, responding to anticipated economic shifts.
As a passive investor, my strategy is not swayed by the transient crests and troughs of business cycles. However, should a discernible secular trend emerge, I stand ready to recalibrate my allocation accordingly.
Regrettably, the depicted plots show that the cycles of Fed and Treasury rates are shorter than the timescale that would trigger my response. so, I revert to my foundational principle: Embrace diversification. By evenly distributing my bonds between those benefiting from rate declines and those offering inflation protection, I forgo the temptation to chase potentially higher returns at the expense of increased risk.
The Reward of Equanimity
You may choose differently, but I secured the ultimate dividend: tranquility. The peace of mind that accompanies a balanced, risk-averse strategy is, for me, the most valuable return on investment.
Additional Information
Fed Dual Mandate. Keep full employment with low inflation.
Inflation, Fed Funds, and Lags. View after half-a-year of Fed rate hikes.
The Bond Book by Annette Thau. McGraw-Hill, NY, NY. 3rd Edition, 2011