Company Pension Rule of Thumb
Every December I get an overall statement from my pension plan The numbers are so large that it demands clear analysis to understand if it’ll run out of money before I run out of time.
The yearly summary is not fake news, but it is not understandable without considerable study. This year (2020 summary) it touts great appreciation in its assets, but neglects to mention the more rapid rate the average pension has grown with a related shortening of payout coverage.

This year (Dec 2018, fund year 2017) I dedicated some time to see if I should feel comfortable about my pension’s prospect.
Confusing Factors
As a large fund covering more than one hundred thousand beneficiaries, you can easily imagine there are significant investments in financial markets. This statement year (2017) had a large appreciation due to the markets. That’s good, but every year will not be so good.
The statement lists the number of potential beneficiaries without detailing how many people are collecting currently. So any analysis is immediately limited by that indefiniteness.
Also confusing were transfers of funds and liabilities due to merging of purchased companies into the plan. Possibly they were included for completeness, but they actually obscured the overall view of systematic changes in the balances. On examination, the transfers were small decimal point changes, not significant in the overall scheme of the pension fund. I’m ignoring them.
Quick Rule of Thumb
I hit upon a good rule of thumb for a snapshot analysis. Number of years of coverage equals asset balance divided by net outlay in reported year. The net outlay can be determined from the statement.
Updated for Year 2019
- Determine how much the pension paid out.
- $4.0B, to 151,000 beneficiaries. Average pension $26,500
- Subtract the amount employees contributed, $942M
- Partial residual $3.1B
- Subtract the amount the company contributed, $741M
- Net outlay $2.4B
- Divide the fund’s net assets $26.5B by the net outlay ($2.4B). That is the amount drawn from assets.
- Calculate the number of years assets will last at current rate of spend
- 11 years
Consider this result from a different angle. A widely used Rule of Thumb for individuals is to limit annual spending to 4% of their financial assets. There are caveats for inflation, but I’m just considering this year, so that isn’t relevant. The pension fund spends 9.0% of its assets yearly. That’s an unsustainable rate over the long term.
Something has happened, equivalent to a financial catastrophe. My pension check is looking iffy.
The average pension has increased in 2 years from 14,500 to 26,500. Although old beneficiaries with lower pensions are being replaced by newer retirees with higher pensions, the average pension growth is beyond simple demographic shifts. Did some sort of Reduction in Force with enhanced pension benefits cause this? Must monitor and research.
Original for Year 2017
- Determine how much the pension paid out.
- $2.2B, to 152,000 (est) beneficiaries. Average pension $14,500.
- Subtract the amount employees contributed, $850M
- Partial residual $1.35B
- Subtract the amount the company contributed, $650M
- Net outlay $0.7B
- Divide the fund’s net assets $22B by the net outlay ($0.7B). That is the amount drawn from assets.
- Calculate the number of years assets will last at current rate of spend
- 31 years
Consider this result from a different angle. A widely used Rule of Thumb for individuals is to limit annual spending to 4% of their financial assets. There are caveats for inflation, but I’m just considering this year, so that isn’t relevant. The pension fund spends 3.1% of its assets yearly. Not bad. That’s an achievable rate, over the long term with their portfolio.
Unless a financial catastrophe occurs, my pension is secure.
Another Company’s Pension Plan
I wondered if all pension funds are so well-funded. I should run this rule of thumb against another company’s pension fund. Hmmm. Here’s a large company that is currently distressed.
- Determine how much the pension laid out.
- $3.2B
- Subtract the amount employees contributed, $1B
- Partial residual $2.2B
- Subtract the amount the company contributed, $450M
- Net outlay $1.75B
- Divide the fund’s net assets $30B by the net outlay ($1.75B), amount from assets
- Number of years assets will last at current rate of spend
- 17 years
This pension fund spends 5.8% of its assets. Not good. They may not be able to recover that rate, over the long term with their portfolio.
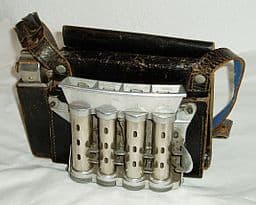
Coin changer image in the public domain, WikiCommons


The statement year 2018 shows similar characteristics, lasting for 31 years. That is, if there were no investment income for the coming years, which should not be the case.
However, there is an oddity. The pension fund shows a 2018 loss on investments of 4%, while the non-management pension fund shows a 2018 gain on investments of 1.5%. I’m surprised by the disparity. I had casually assumed that their asset mixes would be very similar.
With the 2019 stock market up 20% and bond fund values also rising, next year’s statements should be good.